
Technical Analysis
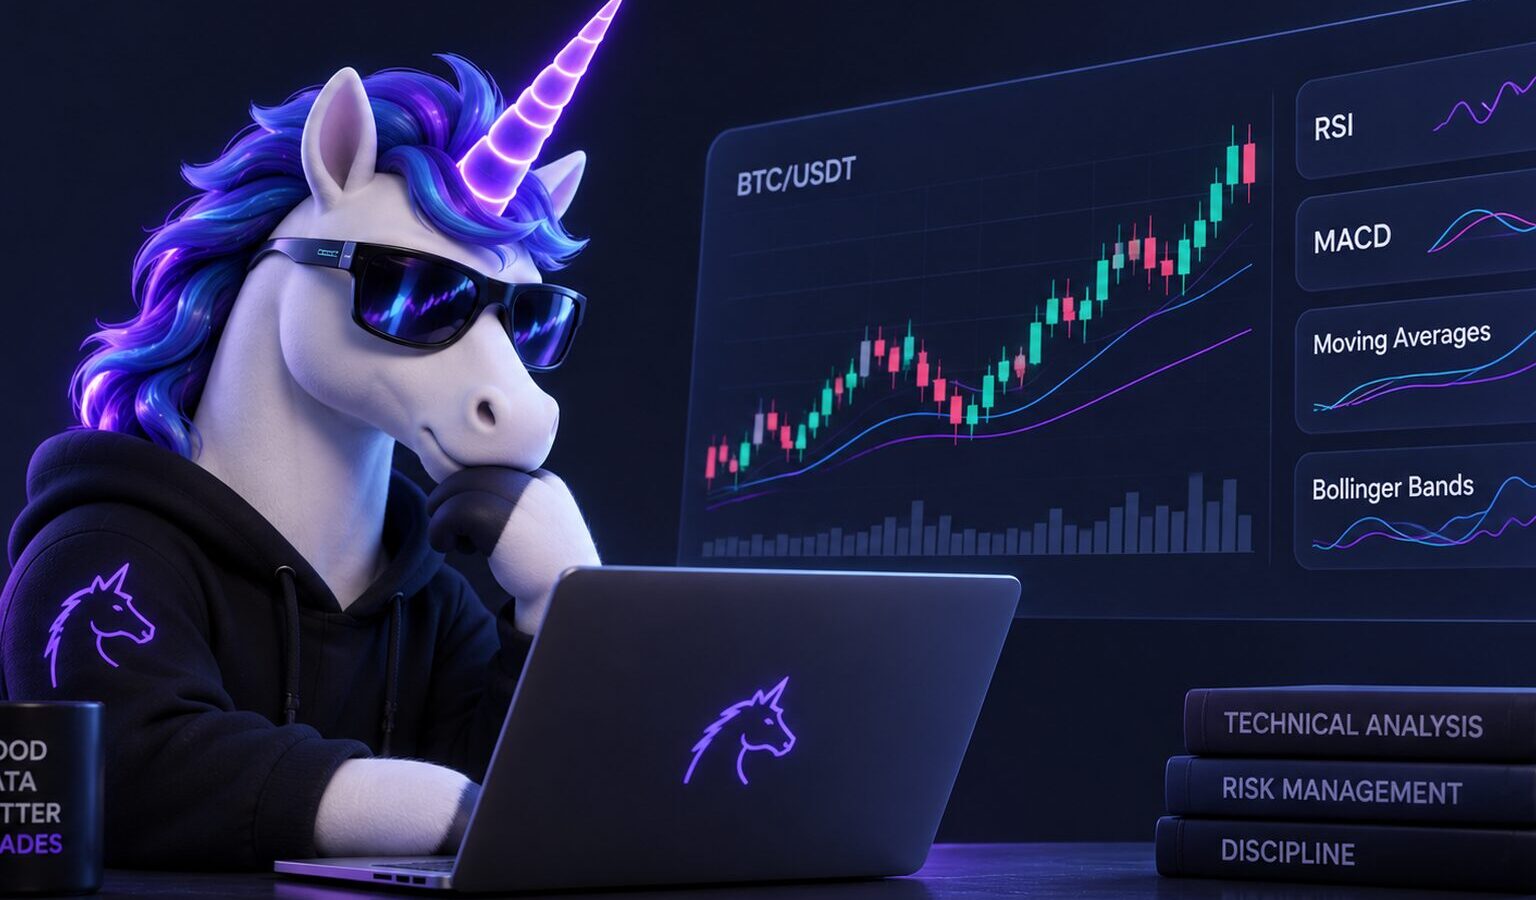
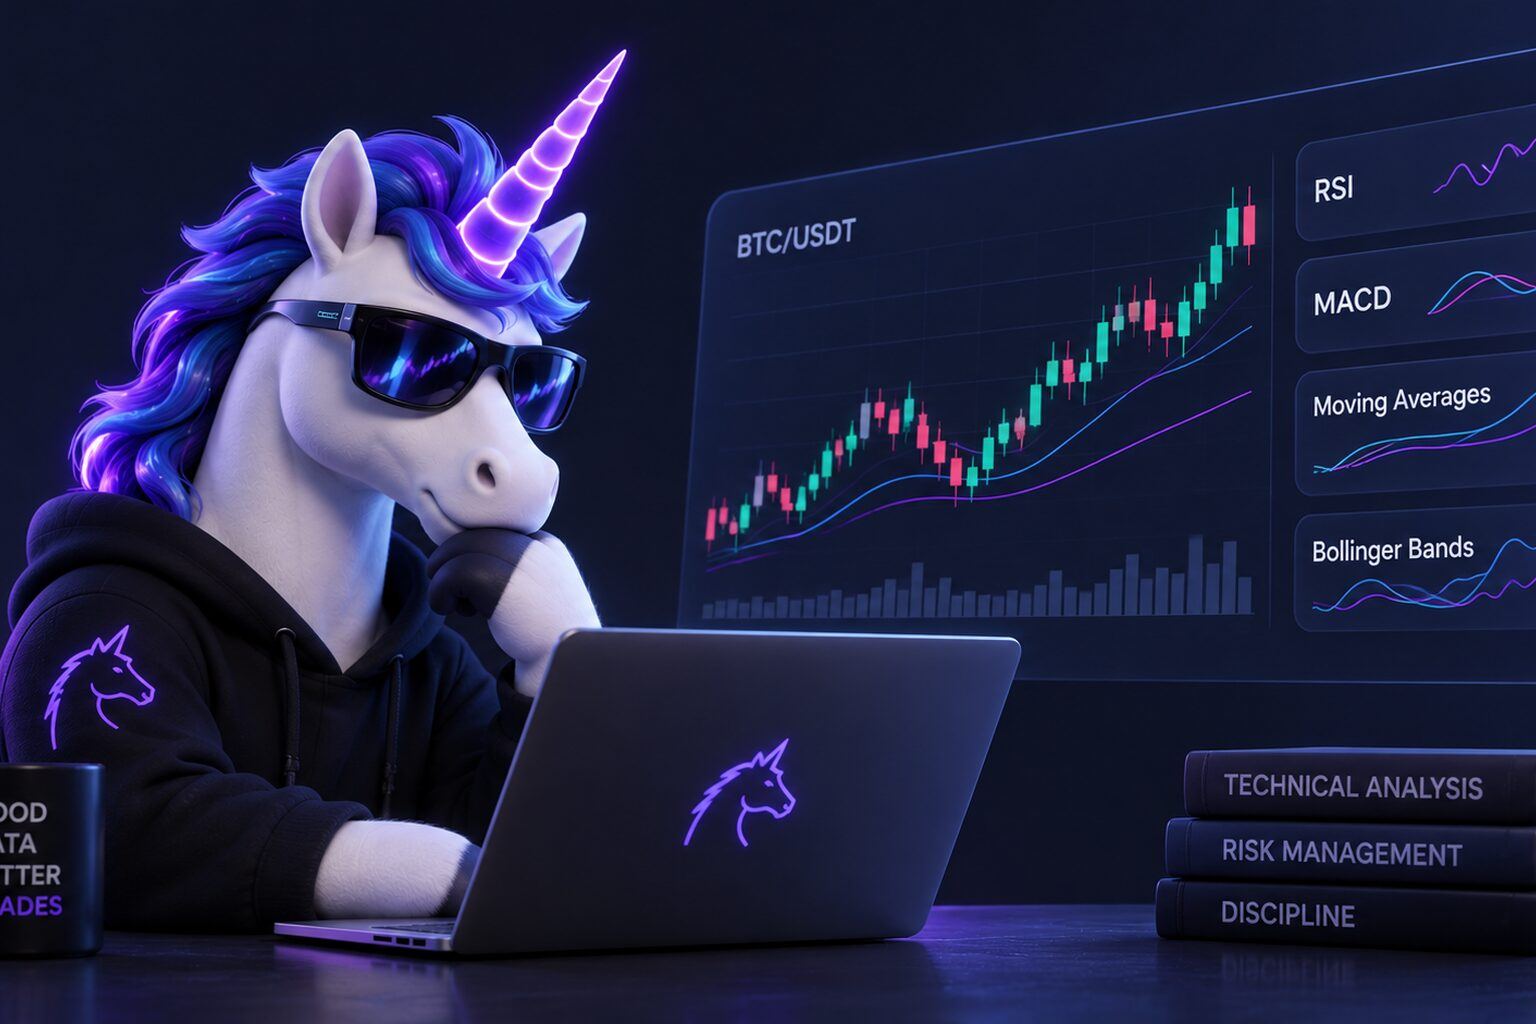
I build AI forecasting tools at Crypticorn and still read charts manually on liquid pairs. This hub explains which technical analysis indicators matter in crypto, how to combine them without "indicator soup," and where TA stops being useful (fresh DEX tokens, event markets, low liquidity).
For probabilistic forecasts and cone reading, pair this with the AI crypto price predictions guide and how to use AI predictions for trading.
Last updated: August 2026. By Johannes Thüroff, M.Eng. Not financial advice. See our disclaimer.
Direct Answer
Crypto technical analysis uses price, volume, and derived indicators to describe trend, momentum, volatility, and participation. The indicators that actually matter for most traders are trend context (moving averages / structure), momentum (MACD, RSI-class oscillators), volume (A/D, volume profile concepts), and volatility bands (Bollinger). None of them predict the future alone. They filter setups before you size against a probabilistic forecast or a defined risk plan.
Key Takeaways
- TA is descriptive, not prophetic. Indicators summarize history. Treat them as filters, not entries by themselves.
- Four buckets: trend, momentum, volume, volatility. One indicator per bucket is enough for most workflows.
- Crypto specifics: 24/7 markets, funding on perps, wicks on thin books, and regime shifts around macro news.
- Combine, do not stack. Five oscillators saying "oversold" is one idea counted five times.
- Pair with forecasts. Use TA for context; use AI cones or up/down scores for horizon-specific uncertainty.
- Skip TA on DEX launches. Two hours of candles is noise. Use on-chain checks instead.
1. What Ta Is (and Is Not) in Crypto
Technical analysis studies market data (mostly price and volume) to classify conditions: trending, ranging, volatile, quiet. It does not tell you who is right about fair value. It helps you avoid trading chop with trend tools, or chasing extended moves without volatility context.
TA is not a substitute for position sizing, fees, or liquidity checks. A perfect MACD cross on a pair with wide spread and $50k depth is still a bad trade.
Basics walkthrough: crypto trading basics: candles, indicators, trend following.
2. Indicator Families (comparison Table)
| Family | Question it answers | Examples | Spoke |
|---|---|---|---|
| Trend | Which direction dominates? | MA structure, higher highs/lows | Basics guide |
| Momentum | Is move accelerating or fading? | MACD, stochastic, RSI-class | MACD strategy |
| Volume | Is participation confirming price? | A/D, volume oscillators | A/D indicator, volume indicators |
| Volatility | How wide is the noise band? | Bollinger Bands, ATR-style reads | Bollinger Bands |
3. how to Combine Indicators Without Soup
A minimal stack I use on liquid perps or majors:
- Trend filter: only take long setups above a defined structure level (or short below).
- Momentum check: MACD or oscillator confirms the move is not exhausted on your entry timeframe.
- Volume confirm: A/D or volume vs average supports the break (not required on every strategy, but catches fakeouts).
- Volatility guard: Bollinger width or band touch tells you if you are buying extension.
- Forecast overlay (optional): compare TA bias to a probabilistic cone or up/down score on the same horizon.
If step 1 and step 5 disagree, I default to smaller size or skip. Indicators lag; models can see regime shifts earlier on some horizons.
4. Oscillators and Divergence
Oscillators flag overbought/oversold relative to their own math, not relative to fundamentals. Divergence (price makes new high, oscillator does not) is a warning, not a reversal order.
- Intro: oscillators in technical analysis
- Stochastic: stochastic oscillator in crypto
- Divergence: what is divergence
5. Order Blocks and Structure Trading
Order-block concepts map institutional-style supply/demand zones onto crypto charts. Useful on liquid pairs with clear session structure; noisy on altcoins dominated by single-wallet wicks.
Deep dive: order block crypto trading.
6. Sentiment as Chart Context
Sentiment feeds (news, social, funding extremes) are not classic TA, but they explain why indicators lie during narrative spikes. We surface sentiment in the Crypticorn dashboard alongside charts.
Read: sentiment analysis in crypto price prediction.
7. where Ta Breaks Down
- Fresh DEX tokens: insufficient history. Use DEX signals instead.
- Event markets: Polymarket/Kalshi contracts need probability math, not RSI. See Polymarket crypto predictions.
- Macro gap opens: indicators lag violent repricing.
- Overfitting: backtests that stack ten indicators on one coin family.
8. where Crypticorn Fits
We do not sell "MACD cross = auto trade." We ship:
- Prediction Dashboard with probabilistic cones and agent Q&A on chart markets.
- Up/Down predictions for short-horizon direction scores.
- News/sentiment overlays to explain when indicators diverge from narrative.
Use TA for structure; use forecasts for horizon-specific uncertainty. Pricing: Crypticorn pricing.
Further Reading (ta Spokes)
- Accumulation/Distribution (A/D) indicator
- MACD crypto strategy
- Bollinger Bands for crypto
- Volume indicators
- Oscillators intro
- Stochastic oscillator
- Divergence explained
- Order blocks
- Sentiment analysis
Final Takeaway
Crypto technical analysis works best as a small set of complementary lenses on liquid markets. Pick one indicator per family, define invalidation, then optionally compare your bias to a probabilistic forecast. Skip the soup. Skip TA on brand-new on-chain tokens. The spokes linked above go deep on each tool; this page is the map.
Faq
Which technical indicator is best for crypto?
None wins alone. Most traders start with trend context plus one momentum tool (often MACD or RSI-class) and one volume read (A/D or volume vs average). The best indicator is the one whose failure modes you understand.
Do technical indicators work on Bitcoin and altcoins?
They work better on liquid pairs with continuous trading and tight spreads. Thin altcoins suffer from wicks, manipulation, and gap-like moves that invalidate clean indicator rules.
How many indicators should I use at once?
Often three to four from different families: trend, momentum, volume, volatility. More than that usually duplicates the same signal and slows decisions.
Can I use TA with AI price predictions?
Yes. TA helps with structure and timing context; AI forecasts add horizon-specific uncertainty bands. When they disagree, size down or skip.
Should I use TA on DEX memecoins?
Generally no until enough history and liquidity exist. Use on-chain safety and holder checks first.
What is the A/D indicator used for in crypto?
Accumulation/Distribution tracks volume flow relative to price to gauge whether participation supports a move. See the dedicated A/D spoke for formulas and limits.
Does Crypticorn replace TradingView?
No. Crypticorn adds probabilistic forecasts, sentiment, and agent Q&A on supported markets. Many traders keep TradingView for drawing tools and use Crypticorn for forecast overlays.
Further reading
Crypto Price Prediction
Bollinger Bands for Crypto Trading: Settings and Strategy (2026)
Sin categoría
Top 10 Metrics To Consider During Fundamental Analysis

Crypto Price Prediction
How to Perform On-Chain Analysis For Crypto Price Prediction
Crypto Trading
Oscillators in Technical Analysis: Crypto Guide (2026)
Crypto Trading
What is the Stochastic Oscillator in Crypto Trading and how to use it!
Crypto Price Prediction