
Crypto Price Prediction

Divergence is the warning light I watch when price keeps making new highs or lows but my oscillator or volume line refuses to follow. It does not tell me the exact minute to reverse. On BTC it sometimes front-runs a slowdown by a few bars. On trending alts it can lie for weeks. This guide covers what divergence is, the types that matter in crypto, which indicators I use to spot it, and how I pair those reads with structure, volume, and our prediction dashboard cones.
Last updated: August 2026. By Johannes Thüroff, M.Eng. Not financial advice. See our disclaimer.
Direct Answer
Divergence in technical analysis happens when price and an indicator disagree on momentum. Classic example: price prints a higher high while RSI or MACD prints a lower high (bearish divergence). That mismatch suggests the trend may be losing fuel. It is a context signal, not a guaranteed reversal trigger. In crypto, divergences often appear early and resolve late, especially on low-liquidity pairs. I use them to tighten risk, wait for structure confirmation, and check whether volume tools like A/D agree before sizing a trade.
Key Takeaways
- Divergence = disagreement. Price makes a new extreme; the indicator does not (or moves the other way).
- Bullish vs bearish. Bullish often shows price lower low + indicator higher low. Bearish shows price higher high + indicator lower high.
- Regular vs hidden. Regular warns of slowdowns; hidden often confirms trend continuation after pullbacks.
- Crypto divergences linger. Bearish divergence can run through an entire alt rally. Treat as risk context, not a timed short.
- Best paired tools: RSI, MACD histogram, Stochastic, and volume-based lines (A/D, OBV).
- Confirm before acting. Structure break, volume, and forecast horizon must agree or I reduce size.
Cluster hub: Part of our crypto technical analysis indicators guide (2026).
What Is Divergence in Crypto Trading?
Divergence occurs when the path of price and the path of a technical indicator split. Price might climb to a new high while MACD histogram peaks lower. Or price dips to a new low while RSI bottoms higher. The indicator is saying momentum behind the move is weaker than the last swing, even though price still looks strong or weak on the chart.
That read is useful on liquid BTC and ETH pairs where oscillator math reflects real two-sided flow. It is noisy on thin alts where one wallet can paint any RSI shape for an hour. I never treat divergence as a standalone entry. It answers: Is this push exhausting relative to the last swing? Then I check trend structure, volume, and whether my forecast cone widens or narrows on the horizon I am trading.

Bullish Vs Bearish Divergence (plain Language)
- Bullish (positive) divergence: price makes a lower low; the indicator makes a higher low. Selling pressure may be fading even while price still dips.
- Bearish (negative) divergence: price makes a higher high; the indicator makes a lower high. Buying pressure may be fading even while price still climbs.
Textbooks treat these as reversal setups. In crypto bull markets I have watched bearish RSI divergence on ETH run for weeks while price grinds higher. The divergence was real momentum decay. The timing was useless for a blind short. I use bearish divergence to trim leverage, tighten stops, or wait for a lower-high break. I use bullish divergence to watch for a reclaim of structure, not to knife-catch a falling alt.
Types of Divergence Compared
| Type | Price vs indicator | Typical read | Crypto caveat |
|---|---|---|---|
| Regular bullish | Lower low vs higher low | Down move losing steam | Can sit unresolved in ranging markets |
| Regular bearish | Higher high vs lower high | Up move losing steam | Common through entire alt rallies |
| Hidden bullish | Higher low vs lower low | Uptrend continuation after dip | Needs clear higher-low structure |
| Hidden bearish | Lower high vs higher high | Downtrend continuation after bounce | Bounces in bear markets can fake it |
| Extended / long-lived | Multiple swings, slow drift apart | Macro momentum shift building | Can span weeks; not a day-trade timer |
Regular divergence
Regular divergence is the pattern most traders mean when they say "divergence." Price prints a more extreme high or low than the prior swing. The oscillator does not. That mismatch often shows up near local tops or bottoms on 4h and daily charts on majors.

Hidden divergence
Hidden divergence looks like the trend continuing, not reversing. In an uptrend, price pulls back to a higher low while the indicator dips to a lower low (hidden bullish). In a downtrend, price bounces to a lower high while the indicator peaks higher (hidden bearish). I use hidden divergence to stay with the dominant trend after a pullback, not to fade the first red candle.

Extended divergence
Extended divergence is regular divergence that persists across many bars, often in sideways or grinding trends. Price and indicator slowly drift apart instead of resolving in one sharp reversal. On weekly BTC charts this can flag a macro momentum shift. On 15-minute alt charts it often means nothing except chop. Longer duration does not mean higher accuracy. It means more time for my stop to get hit if I front-run structure.

Best Indicators for Spotting Divergence
Divergence shows up on any indicator that tracks momentum or participation, but oscillators and volume lines are the usual toolkit. I compare price swings to indicator swings on the same timeframe. Mixing a 1h RSI read with a daily price high creates fake divergence.
| Indicator | What to compare | Strength | Weakness on crypto |
|---|---|---|---|
| RSI | Price highs/lows vs RSI peaks/troughs | Clean on liquid daily charts | Stays overbought for weeks in trends |
| MACD histogram | Price extremes vs histogram peaks | Good momentum decay read | Lags after sharp V-reversals |
| Stochastic | Price vs %K/%D swings | Fast on range-bound pairs | Noisy on 15m low-cap charts |
| A/D or OBV | Price vs volume participation line | Catches distribution early | Exchange volume can be wash-traded |
Deep dives: MACD, oscillators intro, A/D indicator, and Stochastic.
A Workflow I Use (divergence as Risk Context)
- Mark swings on one timeframe. Same bar size for price and indicator (usually 4h or daily on majors).
- Label divergence type. Regular vs hidden changes whether I expect reversal or continuation.
- Cross-check volume. Bearish RSI plus falling A/D on a new price high is stronger than RSI alone.
- Wait for structure. Lower-high break for bearish; higher-low hold for bullish hidden continuation.
- Overlay forecast cone. Compare stretch vs dashboard horizon on the prediction dashboard.
- Size down or skip when divergence says "caution" but cones widen against the trade.
I do not stack divergence on RSI, MACD, and Stochastic simultaneously and call it triple confirmation. That is curve-fitting. One momentum read plus one volume read is enough if structure agrees.
Where Divergence Fails in Crypto
- Not every reversal diverges. Flash crashes and news gaps reverse without a clean setup.
- Trending markets absorb it. Bearish divergence on a vertical meme coin can mark "early," not "top."
- Fake swings on low TF. Wick hunts on 5m create phantom highs and phantom divergences.
- Indicator settings matter. Changing RSI from 14 to 9 because it fit last week usually breaks next week.
- Volume lies on some venues. Pair exchange-reported volume with structure, not blind faith in OBV.
Final Takeaway
- Divergence flags momentum disagreement between price and an indicator.
- Regular divergence warns of slowdown; hidden divergence often confirms trend continuation.
- Crypto divergences can last a long time: use for risk, not for timed entries alone.
- RSI, MACD histogram, Stochastic, and A/D are my core tools; confirm with structure and volume.
- Pair with probabilistic forecasts when horizon matters more than the last two swings.
Compare live cone context on the AI crypto prediction dashboard. Related reads: oscillators, volume indicators, and Bollinger Bands.
Faq
What is divergence in technical analysis?
Divergence is when price and a technical indicator move in conflicting ways. A common case is price making a higher high while RSI or MACD makes a lower high. That suggests momentum behind the price move is weakening even though price still looks strong.
How does divergence work on a crypto chart?
Mark two comparable swing highs or lows on price, then compare the indicator at those same points. If price is more extreme but the indicator is less extreme (or moves the opposite direction), you have divergence. Use the same timeframe and settings for both swings.
Is divergence bullish or bearish?
It can be either. Bullish divergence often shows price at a lower low with the indicator at a higher low. Bearish divergence often shows price at a higher high with the indicator at a lower high. Hidden divergence types point more toward continuation than reversal.
What is the best indicator for divergence?
There is no single best. RSI is the most common on daily majors. MACD histogram is my go-to for momentum decay. A/D and OBV add volume participation. Pick one momentum tool and one volume tool rather than stacking four oscillators.
What is hidden divergence?
Hidden divergence appears during pullbacks in an existing trend. Hidden bullish: price makes a higher low while the indicator makes a lower low in an uptrend. Hidden bearish: price makes a lower high while the indicator makes a higher high in a downtrend. It often signals continuation, not reversal.
Does divergence always mean a reversal?
No. Regular divergence warns that momentum is fading, but price can keep grinding. Many reversals happen without divergence, and many divergences resolve only after long delays in crypto. I treat it as a risk flag and wait for structure confirmation.
Can divergence work with AI price predictions?
Yes, as complementary layers. Divergence describes recent momentum decay; AI cones describe forward uncertainty on a chosen horizon. When bearish divergence appears but the cone widens upward on my trade horizon, I reduce size or wait rather than forcing a fade.
Further reading

Technical Analysis
Crypto Technical Analysis: Indicators That Actually Matter (2026)
Crypto Price Prediction
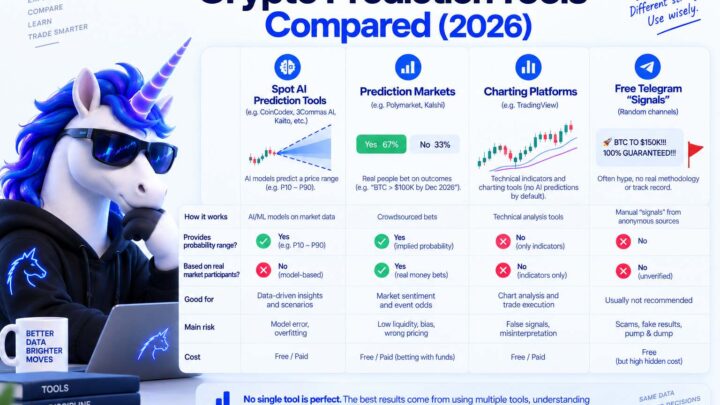
Crypto Prediction Tools Compared (2026): Platforms, Aggregators, and What to Avoid
Crypto Price Prediction
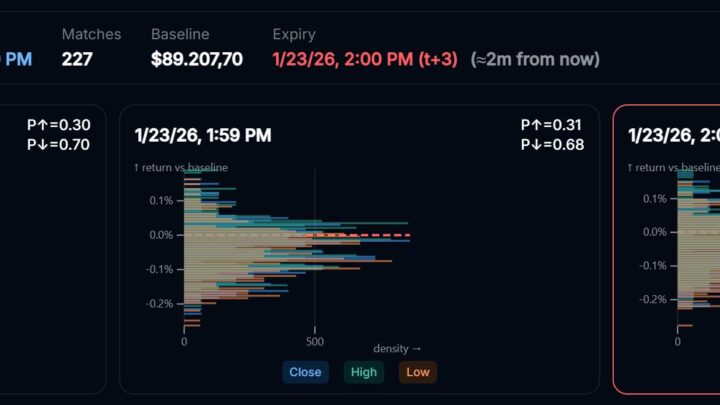
Polymarket Crypto Price Predictions: Crowd Odds vs AI Forecasts (2026)

Crypto Price Prediction
How Accurate Are AI Crypto Price Predictions? (2026)

Crypto Trading
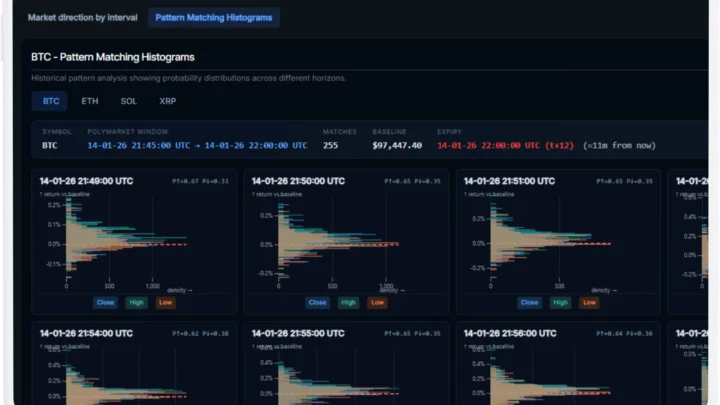
Predict.fun vs Polymarket: The Honest Comparison (2026)
Crypto Trading