
Crypto Price Prediction
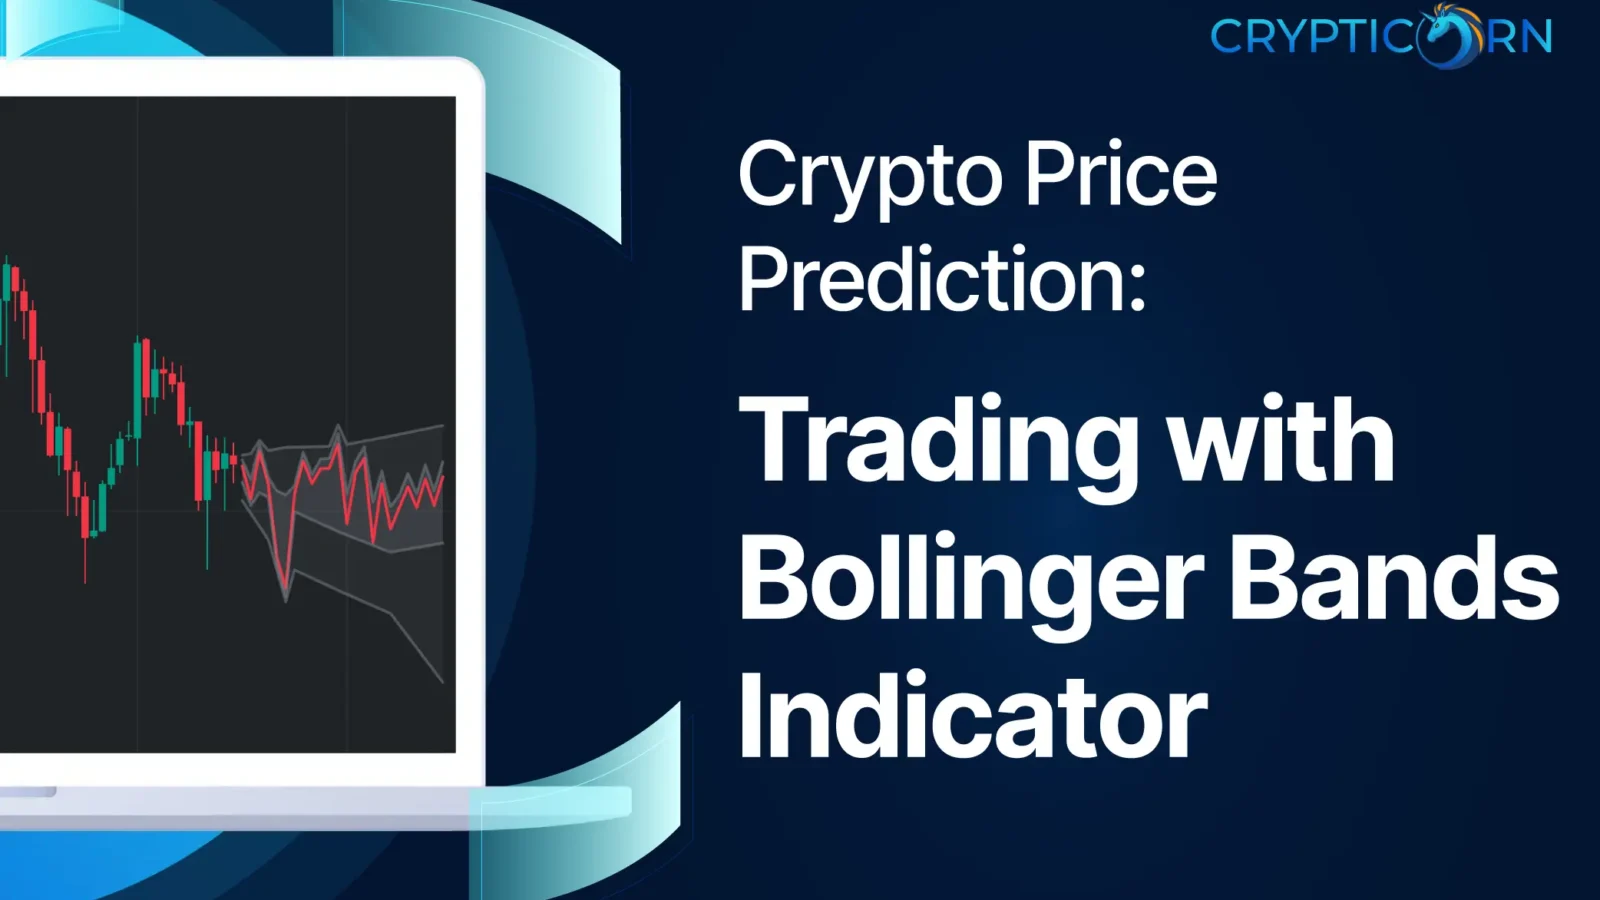
Bollinger Bands are my volatility frame on BTC and ETH before I chase a breakout or fade a wick. They do not tell me guaranteed tops or bottoms. A tag on the upper band in a strong uptrend often means strength, not an automatic short. This guide covers how the three bands are built, how I read squeezes and walks, where bands fail on crypto alts, and how I pair them with momentum, volume, and our prediction dashboard cones.
Last updated: September 2026. By Johannes Thüroff, M.Eng. Not financial advice. See our disclaimer.
Direct Answer
Bollinger Bands plot a middle line (usually a 20-period simple moving average) plus upper and lower bands set at a number of standard deviations (typically 2) from that average. Wider bands mean higher recent volatility; narrow bands mean compression. Price riding the upper band can signal a strong trend, not always overbought. A Bollinger squeeze (bands pinching tight) often precedes a volatility expansion, but direction still needs trend, volume, and structure confirmation. Default settings (20, 2) are a starting point, not a magic formula.
Key Takeaways
- Bands measure volatility, not direction alone. They show how far price typically deviates from its recent mean.
- Middle band = 20 SMA by default. Upper and lower bands add/subtract 2 standard deviations.
- Squeeze warns of expansion. Tight bands mean a big move may be coming; they do not pick the side.
- Band touch is not auto-reversal. Trending crypto can walk the upper or lower band for days.
- Pair with RSI, MACD, or volume. I use bands for volatility context, oscillators for stretch, A/D for participation.
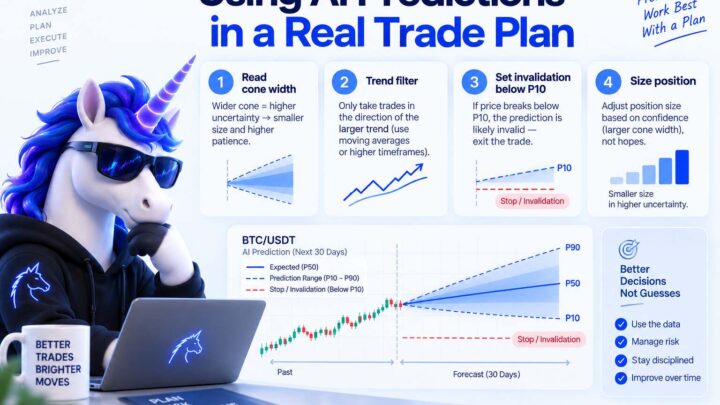
- Check forecast horizon. A 1h squeeze matters less if the 4h cone still widens against the trade.
Cluster hub: Part of our crypto technical analysis indicators guide (2026).

What Are Bollinger Bands on a Crypto Chart?
John Bollinger built the indicator in the 1980s for equities. It works the same on crypto: three lines around price. The middle band is usually a 20-period simple moving average (SMA). The upper band adds two standard deviations of price to that SMA; the lower band subtracts two. About 95% of closes should fall inside the bands under normal distribution assumptions. Crypto is not normal, so treat that stat as context, not law.
I read bands as a volatility envelope. When bands widen, recent swings are large. When they narrow, the market is compressing. Price position inside the envelope (near upper, near lower, or hugging the middle) tells me stretch relative to the last 20 bars on that timeframe, not whether a headline is coming.

How Bollinger Bands Are Calculated
- Middle band: SMA of close over N periods (default N = 20).
- Standard deviation: dispersion of closes around that SMA over the same N periods.
- Upper band: middle band + (K × standard deviation), default K = 2.
- Lower band: middle band − (K × standard deviation).
Most platforms (TradingView, exchange charts) handle this. Changing N to 10 tightens the envelope and increases whipsaws. Changing K to 3 widens bands and reduces tag frequency. I leave 20 and 2 on daily and 4h BTC charts unless I am explicitly testing a hypothesis, not curve-fitting last week's move.
Reading the Three Bands (without Reversal Myths)

Middle band
The middle band is the mean price over the lookback window. In ranging markets, price often mean-reverts toward it. In trends, price can ride above or below the middle band for long stretches. I use middle-band crosses as bias context on 4h+, not as standalone entries on 5-minute alt charts.
Upper band
Touching the upper band means price is near the top of its recent statistical range. In a strong uptrend, that can persist (walking the band). Textbook "overbought, so sell" fails often on BTC bull legs. I treat upper-band tags as extension warnings: tighten stops, check volume participation, look for bearish divergence on RSI or MACD before fading.
Lower band
Lower-band tags flag downside stretch relative to the last 20 bars. In crashes, price can hug or pierce the lower band for days. Catching falling knives because price touched the lower band is how accounts die on illiquid alts. I wait for structure (higher low, reclaim of middle band) plus volume confirmation before treating it as more than a yellow flag.
Squeeze, Bandwidth, and %b
Three derived reads I actually use:
| Concept | What it measures | How I use it |
|---|---|---|
| Squeeze | Bands narrow to multi-week lows | Volatility expansion likely soon; direction from structure + volume |
| Bandwidth | (Upper − lower) / middle | Compare current width to 6-month range on daily charts |
| %B | Where price sits inside bands (0 = lower, 1 = upper) | Quick stretch read; >1 or <0 means outside bands |
A squeeze on BTC daily after weeks of compression often precedes a 5-10% move. I have also watched squeezes resolve into fakeouts on low-volume weekends. Breakout direction gets a size bump when A/D slopes with the break and bandwidth expands on the closing bar, not just a wick.

Overbought and Oversold (with Crypto Caveats)
Bands can flag stretch the same way oscillators do: price near the upper envelope means upside stretch versus the last 20 bars; near the lower envelope means downside stretch. That is not the same as "must reverse now." Trending alts can print consecutive closes above the upper band while funding stays positive for weeks.

Pairing Bollinger Bands with Other Indicators
| Partner | Combined read | Spoke |
|---|---|---|
| RSI / MFI | Band tag + oscillator stretch + divergence | Oscillators guide |
| MACD | Band squeeze breakout + momentum cross | MACD guide |
| A/D or OBV | Breakout with or without participation | Volume indicators |
| Structure | Support/resistance at band edges | Support and resistance |
Example I use on majors: daily squeeze, price breaks upper band on a close (not just a wick), MACD histogram rising, A/D making a higher high. That is a higher-conviction long context than any single band touch. Opposite for distribution: price at upper band, bearish divergence, A/D rolling over.

A Workflow I Use (volatility First)
- Check bandwidth on the timeframe I am trading (4h or daily for swings).
- Label regime: squeeze, trend walk, or range around the middle band.
- One momentum read (RSI or MACD) for stretch or divergence.
- Volume confirm via A/D or raw volume vs 20-bar average.
- Forecast overlay from the dashboard workflow.
- Size down or skip when band break lacks volume and cones disagree.
Bollinger Bands alone do not replace risk limits. They tell me when the market is compressed or extended so I am not surprised by the next 3% move.
Where Bollinger Bands Fail in Crypto
- Chop and ranges: repeated band tags without trend produce false reversal signals.
- Trend walks: shorting upper-band touches in vertical alts is expensive.
- News gaps: ETF, hack, or listing headlines jump price outside bands instantly.
- Low-cap wicks: one sweep tags both bands in an hour on thin books.
- Parameter mining: optimizing 20/2 to 14/1.8 on last month's data rarely holds.
Final Takeaway
- Bollinger Bands frame volatility around a moving average; default 20 periods, 2 standard deviations.
- Squeezes warn of expansion; band walks warn of stretch, not timed reversals.
- Pair bands with oscillators, MACD, and volume for participation context.
- Crypto trends break textbook mean-reversion; confirm with structure before fading.
- Use probabilistic forecasts when horizon matters more than the last 20 bars.
Compare live cone context on the AI crypto prediction dashboard. Related reads: oscillators, MACD, and volume indicators.
Faq
What are Bollinger Bands in crypto trading?
Bollinger Bands are three lines: a middle simple moving average (usually 20 periods) and upper and lower bands set at typically two standard deviations above and below that average. They show how far price is deviating from its recent mean and whether volatility is expanding or contracting.
What is the best setting for Bollinger Bands on crypto?
The common default is 20 periods and 2 standard deviations on whatever timeframe you trade. That is a starting point, not a optimized secret. Shorter periods tighten the bands and increase noise on 15-minute alt charts. I keep 20/2 on 4h and daily for BTC and ETH unless testing a specific hypothesis.
What is a Bollinger Band squeeze?
A squeeze happens when the upper and lower bands narrow sharply, often to multi-week lows. Volatility compression tends to precede a larger move. The squeeze does not tell you long or short. I wait for a closing break with volume and check momentum before sizing up.
Do Bollinger Bands show overbought and oversold?
They can flag stretch relative to recent volatility: price near the upper band is extended up versus the last 20 bars; near the lower band, extended down. In strong trends, price can stay near one band for a long time. Treat tags as context, not automatic reversal orders.
What works best with Bollinger Bands?
RSI or MACD for momentum and divergence, plus a volume line like A/D for breakout confirmation. Bands answer volatility; oscillators answer stretch; volume answers participation. One partner from each layer beats stacking five indicators on the same chart.
How do you read Bollinger Bands on a crypto chart?
Check band width (squeeze vs expansion), where price sits inside the envelope (%B), and whether price is walking a band in a trend or reverting in a range. Then confirm with structure, volume, and your trade horizon before acting.
Can Bollinger Bands work with AI price predictions?
Yes, as complementary layers. Bands describe recent volatility and stretch; AI cones describe forward uncertainty on a chosen horizon. When a squeeze breakout fires but the forecast cone widens against the trade, I reduce size or wait.
Further reading

Technical Analysis
Crypto Technical Analysis: Indicators That Actually Matter (2026)
Crypto Price Prediction
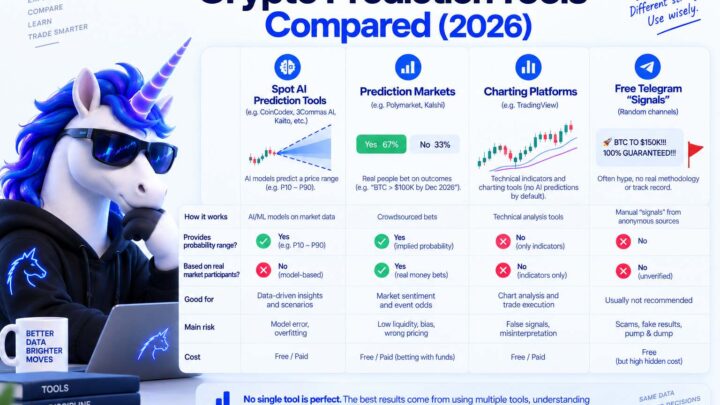
Crypto Prediction Tools Compared (2026): Platforms, Aggregators, and What to Avoid
Crypto Price Prediction
Polymarket Crypto Price Predictions: Crowd Odds vs AI Forecasts (2026)
Crypto Price Prediction
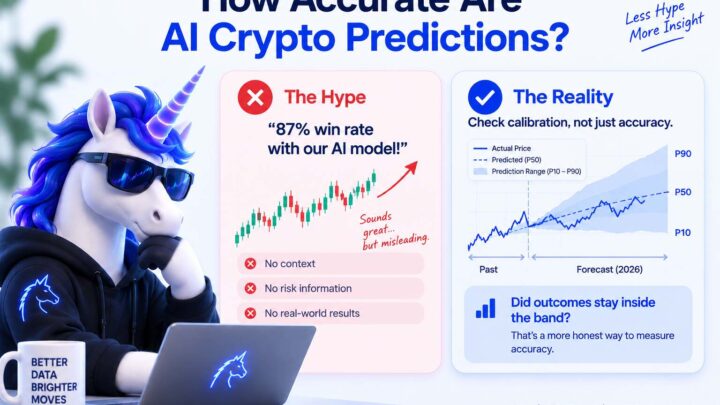
How Accurate Are AI Crypto Price Predictions? (2026)

Crypto Price Prediction
Best Crypto Prediction Markets for 2026 (Honest Comparison)
Crypto Futures