
Crypto Trading

Oscillators are the indicators I reach for when I want to know if a move is stretched, not when I want a guaranteed reversal. On BTC and ETH they help me flag overbought or oversold conditions on a bounded scale. On trending alts they lie for weeks. This guide covers what oscillators measure, which ones I actually use in crypto, and how I pair them with structure, volume, and our prediction dashboard cones.
Last updated: August 2026. By Johannes Thüroff, M.Eng. Not financial advice. See our disclaimer.
Direct Answer
Oscillators in technical analysis are indicators that fluctuate within a range (often 0 to 100) to show momentum stretch, speed, or mean-reversion context. Common examples are RSI, Stochastic, and CCI. When an oscillator nears its upper band, the market may be overbought relative to recent history; near the lower band, oversold. In crypto, those labels are warnings, not automatic sell or buy orders. Oscillators work best on liquid majors with a trend filter and volume confirmation, not as solo triggers on 5-minute alt charts.
Key Takeaways
- Oscillators measure stretch and speed. They summarize recent price behavior; they do not predict news or liquidity events.
- 70/30 and 80/20 are rules of thumb. Trending crypto can stay "overbought" for weeks.
- MACD is momentum, not a classic bounded oscillator. It has no fixed 0-100 overbought zone. See our MACD guide.
- Divergence warns early. Price and oscillator moving opposite ways often precedes a slowdown, not a timed reversal.
- Combine one oscillator with trend + volume. I stack RSI or Stochastic with structure and A/D volume, not three oscillators at once.
- Pair with forecasts on horizon. Stretch on 1h does not override a widening cone on 4h.
Cluster hub: Part of our crypto technical analysis indicators guide (2026).
What Is an Oscillator in Crypto Trading?
An oscillator is a subset of technical indicators that moves within a range instead of tracking price directly. Most bounded oscillators use a 0 to 100 scale. Traders watch where the line sits relative to upper and lower reference levels (often 70/30 or 80/20) to judge whether recent buying or selling has gone too far, too fast.
That framing is useful on liquid BTC or ETH pairs with real volume. It breaks on low-cap alts where one wallet can print any RSI reading for an hour. I treat "overbought" as a risk flag to tighten stops or wait for structure, not as permission to short into a vertical meme trend.
How Oscillators Work (without the Auto-trade Myth)
Most bounded oscillators compare recent closes to recent highs and lows over N bars (14 is the common default on daily charts). The math produces a line that swings between extremes when momentum shifts.
- Upper band touch: recent gains dominate; market may be stretched to the upside.
- Lower band touch: recent losses dominate; market may be stretched to the downside.
- Midline cross: momentum bias flipping (tool-specific).
- Divergence: price makes a new extreme, oscillator does not. See divergence in technical analysis.
The old textbook rule ("cross 70, so sell") loses money in crypto bull trends. I use oscillators to ask: Is this move extended relative to the last two weeks? Then I check trend, volume, and whether my forecast cone agrees on the horizon I am trading.
Common Oscillators Compared (crypto Use)
| Indicator | Scale / type | Best for | Spoke |
|---|---|---|---|
| RSI | 0-100 (14 bars typical) | Stretch vs recent gain/loss balance | MACD guide compares RSI vs MACD |
| Stochastic | 0-100 (%K and %D lines) | Close location inside recent range | Stochastic guide |
| CCI | Unbounded around zero | Distance from statistical mean | CCI guide |
| MACD | Not bounded 0-100 | EMA spread momentum, crossovers | MACD guide |
Rsi in Plain Language
RSI compares average gains to average losses over a lookback window. Above 70, buyers have dominated recent bars. Below 30, sellers have. On a strong BTC uptrend I have seen RSI parked above 70 for days while price grinds higher. That is not a free short signal. It is a reminder that pullbacks may be shallow until structure breaks.

Stochastic Oscillator
Stochastic compares the current close to the high-low range over N bars. It reacts faster than RSI on some pairs, which means more whipsaws on 15-minute charts. I use it mainly on 1h+ timeframes when I already have a trend bias from structure or MACD.

Commodity Channel Index (cci)
CCI measures how far price sits from its statistical mean. It can exceed fixed 0-100 bands, which confuses traders expecting RSI-style limits. I treat CCI as a secondary stretch tool, not a primary entry signal. Full walkthrough: CCI for crypto.

Macd: Momentum Cousin, Not a Classic Oscillator
MACD appears in oscillator lists because it measures momentum, but it does not use a fixed 0-100 overbought grid. It tracks the gap between two EMAs plus a signal line and histogram. I classify MACD as a momentum/trend tool and RSI/Stochastic as bounded stretch tools. Mixing the categories stops me from shorting BTC solely because RSI is 72 while MACD still climbs.

A Workflow I Use (one Oscillator, Not Four)
- Trend filter from the TA hub (structure or MACD bias on 4h).
- One stretch read (RSI or Stochastic on 1h).
- Volume check via volume indicators or A/D.
- Volatility guard with Bollinger Bands.
- Forecast overlay from the dashboard workflow.
- Skip or size down when stretch says "extended" but cones widen against the trade.
Adding RSI + Stochastic + CCI on the same 15-minute chart is indicator soup. One stretch tool is enough if trend and volume agree.
Where Oscillators Fail in Crypto
- Trending markets: "overbought" can persist; fading strength without structure is expensive.
- Thin alts: one wallet moves price; oscillator math looks clean while exit liquidity is zero.
- News gaps: CPI, ETF, or hack headlines reset indicators faster than you can redraw levels.
- Parameter mining: changing 14 to 9 because it fit last week usually breaks next week.
Final Takeaway
- Oscillators flag stretch and momentum speed on bounded or mean-reversion scales.
- RSI, Stochastic, and CCI are the common crypto set; MACD is related but not a 0-100 oscillator.
- Never trade band touches alone in trending crypto; use trend, volume, and risk limits.
- One oscillator plus structure beats stacking three oscillators on the same chart.
Compare live cone context on the AI crypto prediction dashboard. Next deep dives: Stochastic, divergence, and MACD.
Faq
What is an oscillator in technical analysis?
An oscillator is an indicator that moves within a range to show momentum stretch or speed relative to recent price history. Bounded examples include RSI and Stochastic, which often use 0 to 100 scales with upper and lower reference bands.
What is the difference between an oscillator and an indicator?
Every oscillator is an indicator, but not every indicator is an oscillator. Moving averages and Bollinger Bands track price directly. Oscillators like RSI transform price into a bounded momentum score.
How do you read an oscillator on a crypto chart?
Check where the line sits versus upper and lower bands (often 70/30), whether slope is rising or falling, and whether price diverges from the oscillator. Then confirm with trend structure and volume before acting.
Which oscillator is best for crypto?
There is no universal best. RSI is the most common stretch tool on majors. Stochastic reacts faster but whipsaws on low timeframes. MACD is momentum, not a classic 0-100 oscillator. Pick one stretch tool and master it with a trend filter.
Does overbought mean price will drop?
Not necessarily. Overbought means recent buying dominated relative to the lookback window. In strong uptrends, price can stay overbought while grinding higher. Treat it as a risk context signal, not a timed short entry.
Is MACD an oscillator?
MACD is a momentum indicator derived from EMAs. It is often grouped with oscillators because it signals momentum shifts, but it does not use fixed overbought/oversold bands like RSI. See our dedicated MACD guide for how to read line, signal, and histogram.
Can oscillators work with AI price predictions?
Yes, as complementary layers. Oscillators describe recent stretch; AI cones describe forward uncertainty on a chosen horizon. When they disagree, I reduce size or wait rather than forcing the trade.
Further reading

Technical Analysis
Crypto Technical Analysis: Indicators That Actually Matter (2026)
Crypto Price Prediction
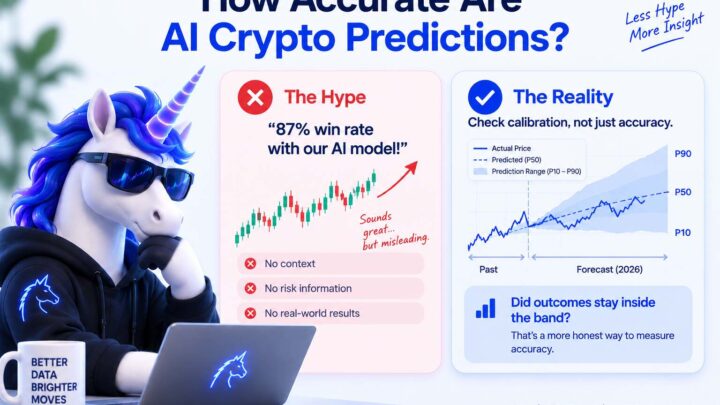
How Accurate Are AI Crypto Price Predictions? (2026)
Crypto Trading
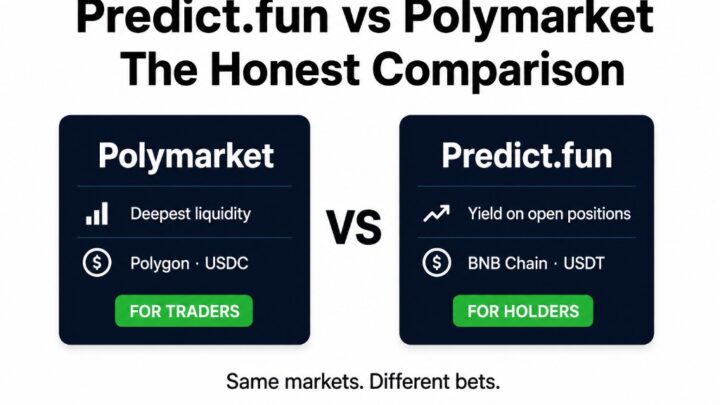
Predict.fun vs Polymarket: The Honest Comparison (2026)
Crypto Trading
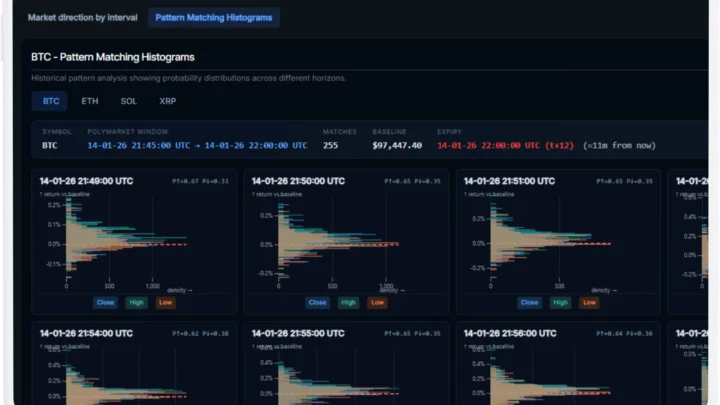
Ultimate Guide to Polymarket Crypto Trading (2026)
Crypto Trading
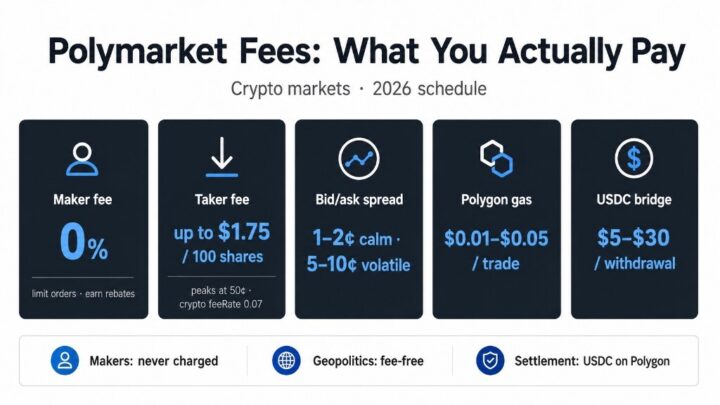
Polymarket Fees 2026: Taker Fees, Spread & Real Costs
Crypto Trading