
Crypto Price Prediction
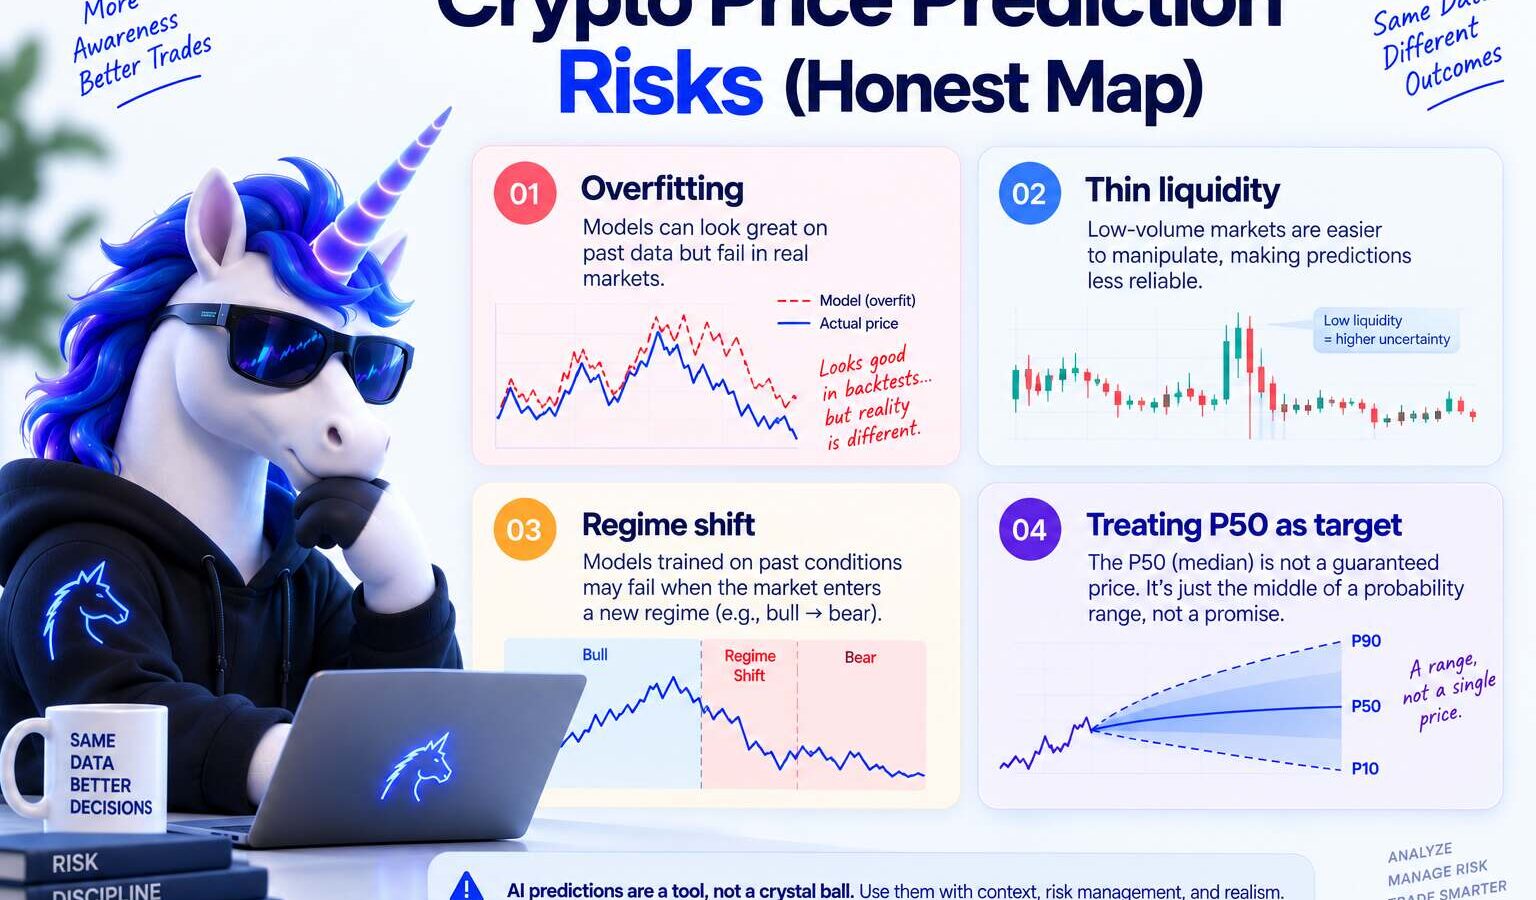
I build probabilistic forecasting tools at Crypticorn and trade short-horizon crypto markets. Every stack I have shipped, including ours, eventually hits a regime break, a data glitch, or my own sizing mistake. This page is the risk appendix I wish I had before I trusted a clean backtest. For what AI prediction is and is not, start with the definitional explainer. For accuracy in plain language, read how accurate AI crypto price predictions really are.
Last updated: August 2026. Not financial advice.
Direct Answer
The biggest risks in crypto price prediction are not “the model was wrong once.” They are (1) misreading uncertainty (chasing point targets instead of bands), (2) market structure (fees, spread, manipulation, thin books), (3) regime change (models trained on old volatility behaving badly in new conditions), (4) news shocks models cannot see early, and (5) behavioral oversizing when a forecast sounds confident. Honest tools reduce risk by showing probabilities and ranges. They do not remove it.
Key Takeaways
- Models compress uncertainty; they do not erase it. A narrow cone can still be wrong. A wide cone is a warning, not a bug.
- Small edges die from costs. Spread, taker fees, and overtrading erase statistical advantage before you notice.
- Regime breaks are normal. What worked in a trending month can fail in chop or after a macro headline.
- Vendor marketing is a risk category. “90% accurate” without horizon, label, and live calibration data is a red flag.
- Your sizing matters more than the last signal. A 54% edge with 5x leverage is still a blow-up story.
- Mitigation is process: define invalidation, match horizon to tool, size down when uncertainty is high, and track calibration over time.
Risk Map At a Glance
| Risk | What it looks like in practice | What helps (not a cure) |
|---|---|---|
| False certainty | Trading a single target price or “high confidence” label | Demand P10–P90 bands or calibrated probabilities; see workflow guide |
| Overfitting / backtest theater | Perfect historical curve, weak live results | Ask for out-of-sample and live logs; read how models work |
| Regime change | Model keeps calling “up” in a sideways week | Reduce size, widen invalidation, or stand down when cone is wide |
| Liquidity & manipulation | Slippage on alts; whale wicks on low-cap names | Stick to liquid majors for ML; use on-chain context cautiously |
| News / black swan | ETF headline, exchange failure, regulatory action | Hard risk caps; news awareness; do not hold oversized through events |
| Fee & spread bleed | Positive model edge, negative PnL after costs | Count all-in costs; fewer trades when edge is thin |
| Behavioral | FOMO size-up after one win; revenge trading | Fixed risk rules; pre-written invalidation; breaks after losses |
1. Misreading the Forecast (the Quiet Killer)
The most expensive mistake I see is semantic. Someone reads a median path or direction score as a promise. It is not.
Honest AI output looks like a probability cone: a P10–P90 band plus a median. When the band is wide, the model is telling you it does not know much. Trading that like a sniper shot is on you, not the math.
If a tool hides uncertainty, it is optimized for marketing, not for your account survival.
Same rule on prediction markets: a 65¢ yes price is crowd-implied probability, not a spot ML forecast. Mixing the two without thinking is its own risk. See crowd odds vs AI forecasts.
2. Model and Data Risks
Price ML learns patterns in historical candles, flows, and features. That breaks when:
- The world changes. Volatility regime shifts, fee structures change (Polymarket 2026 taker fees are a real example), or correlation structures flip.
- The label lies. “Up” defined too loosely inflates win rates in backtests.
- Data leaks. Future information sneaks into training features. Retail vendors rarely document this well.
- Small-cap illiquidity. Whale prints dominate; pattern models confuse noise for signal.
Our dashboard focuses on majors partly for this reason: BTC, ETH, SOL, and similar names have enough history and depth that the model is not only fitting one whale’s Tuesday.
3. Market Structure: Volatility, Chop, and Manipulation
Crypto stays volatile. Indicators can sit overbought for days. Sideways chop invalidates directional calls even when the model direction was “reasonable” on average.
Manipulation risk rises as market cap falls. Pump-and-dump dynamics on thin tokens can look like a trend on a chart until liquidity vanishes. I do not treat low-cap ML calls the same as BTC 15-minute windows.
If you want on-chain context for whale behavior, pair forecasts with research tools, not blind trust. Our on-chain analysis guide is about context, not prophecy.
4. Black Swans and Headline Risk
Models trained on prices alone do not know a court filing is coming. Exchange failures, ETF approvals, sudden regulatory posts, and macro shocks move markets faster than a cone refresh cycle.
That does not mean “never trade.” It means cap exposure through events you cannot model and accept that any open position can gap.
5. Tool and Vendor Risk
Free forecast pages and hype dashboards are part of the risk surface. Warning signs:
- Single year-end price with no band
- Win-rate screenshots without sample size or horizon
- Entry, take-profit, and stop cards with no public calibration log
- Language like “guaranteed” or “passive profits”
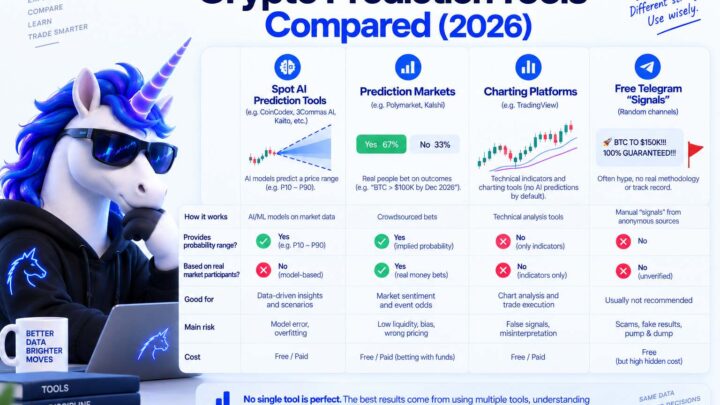
We publish comparison content for a reason. See crypto prediction tools compared for how to sort real infrastructure from SEO farms.
Crypticorn is paid software with explicit uncertainty bands. That is a feature, not a weakness. We still do not guarantee outcomes, and we are not an autonomous trading agent product today.
6. Behavioral and Leverage Risk
The model can be slightly right and you can still lose badly.
Fear makes you size too small on valid setups. Greed makes you lever up when the cone is wide. Revenge trading after one loss is the classic account killer. I have done all three early in my career. The forecast did not cause the damage. My response did.
Leverage turns small statistical edges into large variance. If you trade Polymarket or perps, read position sizing on prediction markets before you scale size because a model leaned bullish.
How to Navigate These Risks (practical Checklist)
- Match horizon to decision. Use 15-minute to daily tools for short windows; do not force a six-hour cone into a multi-month investment thesis.
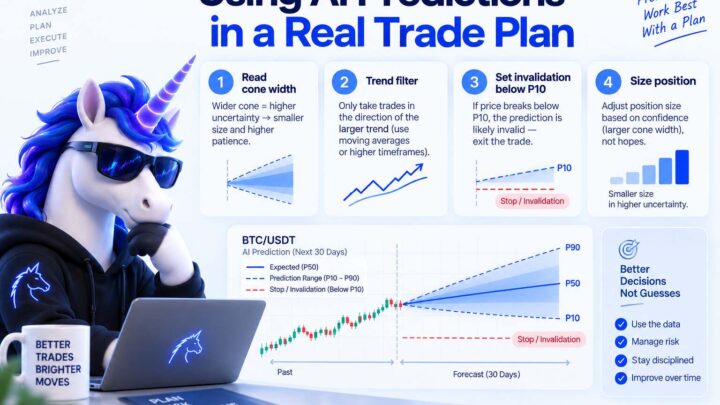
- Define invalidation before entry. Price level, time stop, or “cone flipped” rule. Write it down.
- Size from uncertainty. Wider band or weaker direction score → smaller risk. No hero bets on “maybe 52%.”
- Count all-in costs. Fees, spread, funding, gas. A few points of edge can be zero after costs.
- Track calibration, not vibes. Over many trades, do your ~60% calls land near 60%? If not, stop trusting the label.
- Add context, not noise. Sentiment, news, and funding can explain when to stand down. Our Agent layer is meant for that interpretive step, not to override math silently.
- Use tools as input, not autopilot. Same workflow as the complete AI prediction guide: check → compare → size → invalidate.
What Crypticorn Does and Does Not Promise
We ship: forward probability cones on the Prediction Dashboard, directional strength scores on up/down horizons, and optional ChatGPT access for the same stack.
We do not ship: guaranteed profits, exact future prices, or a substitute for risk management. When our cone is wide, that is the product working honestly.
Final Takeaway
- Risk starts with misreading uncertainty. Bands and calibration beat point targets.
- Markets change faster than models. Regime breaks and headlines are expected, not exceptional.
- Costs and behavior dominate. Small edges need small size and discipline.
- Pick tools that show limits. If they cannot explain what fails, they cannot help you navigate failure.
If you want probabilistic forecasts with the limits visible upfront, try the Prediction Dashboard. Soft mention, same rule as always: decision support, not certainty.
Faq
What are the main risks of crypto price prediction?
The main risks are misreading uncertainty, model overfitting, regime change, liquidity and manipulation on thin markets, news shocks, trading costs, and behavioral oversizing. No forecast removes these. Process and sizing reduce how often they hurt you.
How reliable are crypto price predictions?
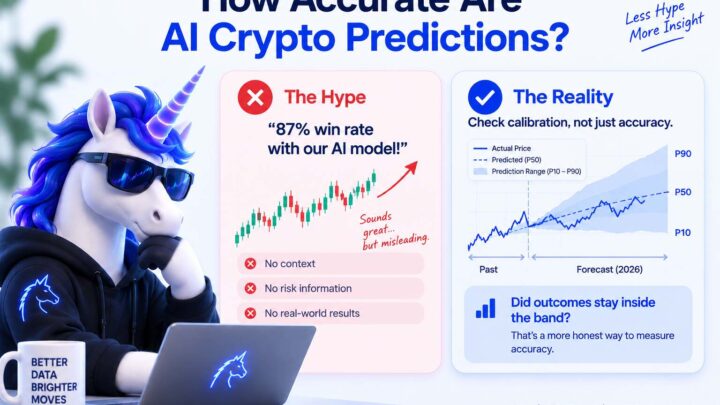
Exact price predictions are usually unreliable on multi-day horizons. Short-horizon directional models can show small edges above 50% when measured fairly, but reliability should be judged by calibration and live results, not marketing win rates. See our dedicated accuracy article.
Why is crypto hard to predict?
Crypto combines high volatility, fragmented liquidity, rapid news, and participant behavior that shifts by regime. Price-only models miss headlines by design. That is why honest systems show ranges and short horizons instead of year-ahead targets.
Can AI crypto price prediction be safe?
Safer is not the same as safe. You can make it less dangerous by using probabilistic outputs, capping risk per trade, avoiding leverage you do not understand, and stopping when calibration drifts. No AI makes crypto risk-free.
Does a wide probability cone mean the model is broken?
Usually the opposite. A wide P10–P90 band means the model sees high uncertainty. Treating a wide cone like a high-conviction signal is the mistake. Narrow bands deserve more attention, still not blind trust.
Should I rely only on prediction tools?
No. Use them as one input alongside costs, market structure, news, and your risk rules. Tools that encourage full autopilot or guaranteed returns are the highest-risk category of all.
How does this relate to prediction market trading?
Prediction markets add contract, fee, and resolution risks on top of forecast risk. AI spot tools and crowd odds answer different questions. Use both deliberately, as covered in our prediction markets comparison and Polymarket odds articles.
Further reading
Crypto Price Prediction
Crypto Prediction Tools Compared (2026): Platforms, Aggregators, and What to Avoid
Crypto Price Prediction
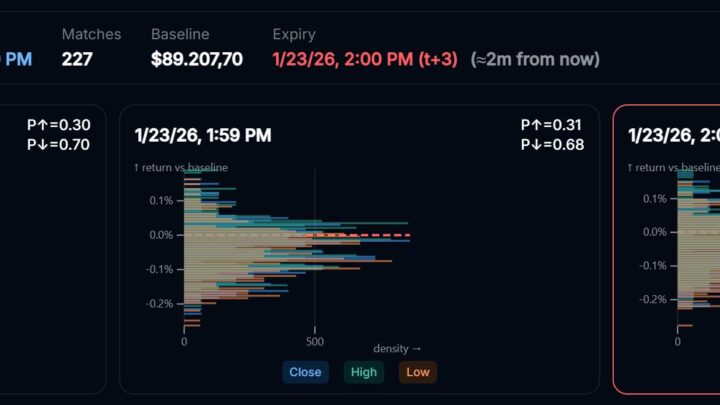
Polymarket Crypto Price Predictions: Crowd Odds vs AI Forecasts (2026)
Crypto Price Prediction
How Accurate Are AI Crypto Price Predictions? (2026)

Crypto Price Prediction
Best Crypto Prediction Markets for 2026 (Honest Comparison)
Crypto Futures
How to Use AI Crypto Predictions for Trading (2026)

Crypto Price Prediction