
Crypto Price Prediction

Volume indicators answer a question price alone hides: is anyone actually participating in this move? I use them on BTC and ETH before I trust a breakout or fade a wick. They do not predict the next headline or listing pump. On thin alts, exchange-reported volume can be mostly noise. This guide covers the volume tools I keep on my charts (OBV, A/D, MFI, Chaikin), how they differ, where they fail in crypto, and how I pair them with structure and our prediction dashboard cones.
Last updated: August 2026. By Johannes Thüroff, M.Eng. Not financial advice. See our disclaimer.
Direct Answer
Volume indicators transform trading activity into lines or oscillators you can compare to price. On-balance volume (OBV) adds or subtracts whole bars of volume based on up or down closes. Accumulation/Distribution (A/D) weights volume by where the close sits inside the bar's range. Money Flow Index (MFI) blends price and volume into a 0-100 oscillator. In crypto, these tools work best on liquid majors as confirmation filters: rising price on rising participation is stronger than rising price on flat volume. They are not standalone buy or sell triggers.
Key Takeaways
- Volume confirms participation. A price move with expanding volume has more two-sided conviction than a move on thin prints.
- OBV vs A/D: OBV uses close vs prior close; A/D scores close location inside the bar. They often agree; divergences between them are worth a second look.
- MFI is volume-weighted RSI. It flags stretch with money flow, not price alone.
- Exchange volume lies sometimes. Wash trading and perp-heavy books distort raw bar volume on alts.
- Divergence applies here too. Price up + volume line down is a distribution warning, not a timed short. See our divergence guide.
- One volume tool + one momentum tool. I pair A/D or OBV with MACD or RSI, not four volume lines at once.
Cluster hub: Part of our crypto technical analysis indicators guide (2026).
What Are Volume Indicators in Crypto Trading?
Most chart indicators focus on price geometry: moving averages, Bollinger Bands, RSI. Volume indicators use how much traded (and sometimes at what prices) to estimate whether buyers or sellers are driving the session. Raw volume bars at the bottom of a chart are the simplest form. Cumulative lines like OBV and A/D smooth those bars into trends you can compare across weeks.
Crypto trades 24/7, so "session volume" is whatever timeframe you choose. I read volume on 1h and 4h for intraday context and daily for swing bias. A spike at 02:00 UTC on a thin pair might be one market maker, not a crowd. Context matters more than the color of a single bar.
Why Volume Matters (and What It Cannot Do)
- Trend confirmation: breakouts that expand volume on majors often hold better than breakouts on declining volume.
- Liquidity context: higher volume usually means tighter spreads and less slippage on liquid pairs. It does not guarantee profit.
- Distribution detection: price grinding up while cumulative volume lines roll over can flag low-participation rallies.
- Not a news filter: ETF headlines, hacks, and listing rumors move price before volume math catches up.
I do not treat "high volume = bullish" as a rule. Capitulation selloffs also print huge volume. The question is whether volume confirms the direction you are trading on the timeframe you care about.
Popular Volume Indicators Compared
| Indicator | Input | Output type | Best for | Crypto caveat |
|---|---|---|---|---|
| Raw volume bars | Traded size per bar | Histogram | Spotting spikes vs average | Exchange reporting differs; wash risk on alts |
| OBV | Volume signed by up/down close | Cumulative line | Simple participation trend | All-or-nothing per bar ignores wick location |
| A/D line | Volume × close location in range | Cumulative line | Absorption vs distribution inside bars | Full walkthrough in our A/D guide |
| MFI | Typical price × volume over N bars | 0-100 oscillator | Overbought/oversold with money flow | Can stay extreme in trends like RSI |
| Chaikin Oscillator | EMA spread of A/D | Momentum oscillator | Rate of change in A/D slope | Secondary tool; noisy on 15m alts |
On-Balance Volume (OBV)
Joseph Granville's OBV adds the bar's full volume when close is above the prior close, subtracts it when below, and leaves it unchanged when equal. The level matters less than the slope: rising OBV alongside rising price suggests buyers are participating. Falling OBV into a rally suggests the move may be running on fumes.
OBV is blunt. A bar that closes $1 above the prior close gets the same treatment whether the wick swept 5% lower first or not. That is why I cross-check OBV with A/D when they disagree. If OBV climbs but A/D flatlines, closes may be barely winning the bar even though volume prints green.
Accumulation/Distribution (A/D) line
A/D weights each bar's volume by where price settled between the high and low. Close near the top adds most of the volume; close near the bottom subtracts it. That makes A/D my default cumulative volume line on majors. Full math, OBV comparison, and crypto failure modes are in the dedicated A/D indicator guide.

Money Flow Index (MFI)
MFI is often called volume-weighted RSI. It uses typical price (high + low + close) / 3 multiplied by volume over a lookback window (14 bars is common). Readings above 80 and below 20 are overbought/oversold zones in textbooks. On trending crypto, MFI can hug the upper band for weeks just like RSI. I use it as a stretch warning, not a reversal timer.
MFI helps when I already have a trend bias from structure or MACD. "Overbought" on MFI plus bearish volume divergence plus a lower-high break is a stronger short context than MFI alone at 82.
Chaikin Oscillator
The Chaikin Oscillator is the difference between short and long EMAs of the A/D line. It measures acceleration in accumulation/distribution, not absolute level. I treat it as a secondary momentum read on A/D slope. On low-cap 15-minute charts it whipsaws. On daily BTC it occasionally flags when participation momentum is fading ahead of price.
Volume Divergence with Price
Volume divergence uses the same logic as oscillator divergence: price makes a new extreme, the volume line does not. Classic bearish case: price prints a higher high while OBV or A/D prints a lower high. That can mean the rally is not backed by participation. Classic bullish case: price prints a lower low while the volume line bottoms higher.
In crypto, volume divergences can linger through entire alt seasons. I use them to tighten stops and wait for structure breaks, not to pick exact tops. Deep dive: divergence in technical analysis.
A Workflow I Use (one Volume Line, Not Three)
- Trend filter from the TA hub (structure or MACD on 4h).
- Pick one cumulative line: A/D on majors, sometimes OBV for quick scans.
- Check raw volume vs 20-bar average on the breakout bar.
- Momentum stretch via RSI or MFI on 1h if needed.
- Forecast overlay from the dashboard workflow.
- Skip or size down when price confirms but volume lines and cones disagree.
Stacking OBV, A/D, Chaikin, and MFI on one 15-minute alt chart is indicator soup. One participation read plus one momentum read is enough if structure agrees.
Where Volume Indicators Fail in Crypto
- Wash trading: reported volume on some pairs does not reflect real demand.
- Perp vs spot split: price may follow perps while spot volume lags, skewing cumulative lines.
- Cross-exchange gaps: aggregators blend feeds; a move on one venue may not show cleanly.
- Stablecoin flows: huge transfers are not always directional bets on the pair you are charting.
- Air-drop and bot spikes: one-day volume surges mean little without follow-through.
Final Takeaway
- Volume indicators measure participation, not guaranteed direction.
- OBV, A/D, MFI, and Chaikin each slice volume differently; know which question you are asking.
- Use volume to confirm or challenge price moves on liquid pairs, not to override macro news.
- Divergence between price and volume lines is a risk flag; timing still needs structure.
- Pair volume context with momentum tools and probabilistic forecasts on your horizon.
Compare live cone context on the AI crypto prediction dashboard. Next reads: A/D deep dive, oscillators, and Bollinger Bands.
Faq
What is a volume indicator in technical analysis?
A volume indicator uses trading activity (size and sometimes price location) to estimate buying or selling pressure. Examples include on-balance volume, the accumulation/distribution line, and the Money Flow Index. They help you judge whether price moves have participation behind them.
What is the best volume indicator for crypto?
There is no universal best. Raw volume bars plus one cumulative line (A/D or OBV) cover most of my work on BTC and ETH. MFI adds stretch context when paired with trend tools. The best choice depends on pair liquidity and timeframe, not a fixed ranking.
What is the difference between OBV and A/D?
OBV adds or subtracts the entire bar's volume based on whether the close is above or below the previous close. A/D scales volume by where the close sits inside the current bar's high-low range. They often agree; when they diverge, I trust price structure first and re-check on a higher timeframe.
How do you trade with volume indicators?
I use volume to confirm or challenge a setup I already have from structure and momentum. Rising price on rising A/D or OBV supports a long bias. Price breakout on declining volume gets a smaller size or a wait. I do not enter solely because volume spiked once.
What is a good trading volume for cryptocurrency?
Compare volume to the pair's own recent average, not to circulating supply alone. A thin alt with 10x average volume may still be untradeable size-wise. On majors, I watch whether breakout bars exceed the 20-period average and whether cumulative lines slope with price.
Can volume indicators show divergence?
Yes. When price makes a higher high but OBV or A/D makes a lower high, that is bearish volume divergence. It warns that participation may be fading. Like oscillator divergence, it can persist a long time in crypto before price turns.
Do volume indicators work with AI price predictions?
Yes, as complementary layers. Volume lines describe recent participation; AI cones describe forward uncertainty on a chosen horizon. When a breakout looks strong on price but volume lines and widening cones disagree, I reduce size or wait.
Further reading
Crypto Price Prediction
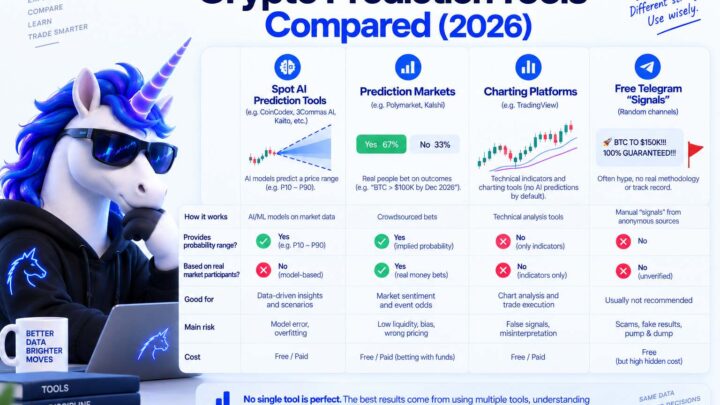
Crypto Prediction Tools Compared (2026): Platforms, Aggregators, and What to Avoid
Crypto Price Prediction
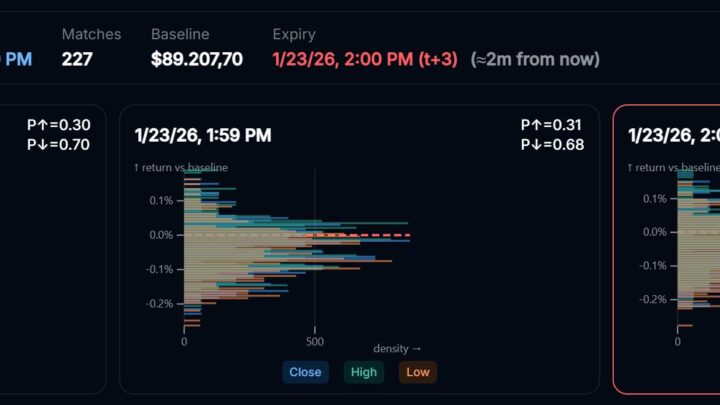
Polymarket Crypto Price Predictions: Crowd Odds vs AI Forecasts (2026)

Crypto Price Prediction
How Accurate Are AI Crypto Price Predictions? (2026)

Crypto Price Prediction
Best Crypto Prediction Markets for 2026 (Honest Comparison)

Crypto Futures
How to Use AI Crypto Predictions for Trading (2026)

Crypto Price Prediction