Whenever someone asks “how accurate are AI crypto price predictions?”, they’re usually imagining a scoreboard: win rate, green arrows, a backtest that never loses. I build these models for a living, and the honest answer is more boring and more useful: accuracy means calibration and short-horizon edge, not prophecy. If a vendor won’t talk about uncertainty bands or out-of-sample results, they aren’t answering the accuracy question, they’re dodging it. Last updated: August 2026. Not financial advice.
Direct answer
AI crypto price predictions are not highly accurate as exact price forecasts, and serious systems don’t claim that. On short horizons (minutes to hours), honest directional models typically clear only a few percentage points above 50% when measured properly, an edge that matters only with sizing, fees, and discipline. What you should demand instead is calibration: when the model says ~70%, outcomes should land near 70% over a large sample, and the P10–P90 band should actually contain price most of the time. Claims of 90%+ “accuracy” almost always measure trivial labels, leaky backtests, or marketing.
Key takeaways
- “Accurate” is the wrong default word for point prices; ask about calibration, horizon, and live results.
- Short-horizon directional edges are usually small (a few points over coin-flip), not lottery tickets.
- A probability cone (P10–P90) is the honest accuracy format, wide band = “we don’t know much.”
- Judge systems on out-of-sample / live performance, never on a single backtest screenshot.
- Fees, spread, and overtrading can erase a real statistical edge before you notice.
- For definitions and workflow, pair this with what AI prediction is and the complete guide.
What people mean by “accurate” (and why it misleads)
Three different questions get smashed into one phrase:
- Exact price accuracy, “Will BTC be at $X on Friday?” Almost never the right ask. Markets are too noisy; models that pretend otherwise are selling comfort.
- Directional accuracy, “Did the up/down call match the window outcome?” Measurable. Usually modest when the test is fair.
- Probabilistic calibration, “Do 70% forecasts happen ~70% of the time?” This is the adult metric. It’s also the one marketing pages skip.
If the only number on the landing page is a huge win rate, assume the definition of “win” was chosen after the fact.
I care about (2) and (3). Exact-price MAE on multi-day targets is mostly a storytelling contest.
What honest short-horizon accuracy looks like
On liquid majors, over windows like 15 minutes to a few hours, a real directional edge often shows up as something like 52–55%+ on carefully labeled calls, sometimes a bit higher in friendly regimes, often worse when structure changes. That “+” is doing a lot of work: label definition, costs, and whether flat/no-trade decisions count.
A few points above 50% is not exciting on a single ticket. It is exactly the shape of edges that survive in competitive markets: small, fragile, and useful only if you:
- trade enough independent trials,
- size down when uncertainty is high,
- and refuse to invent conviction the model didn’t give you.
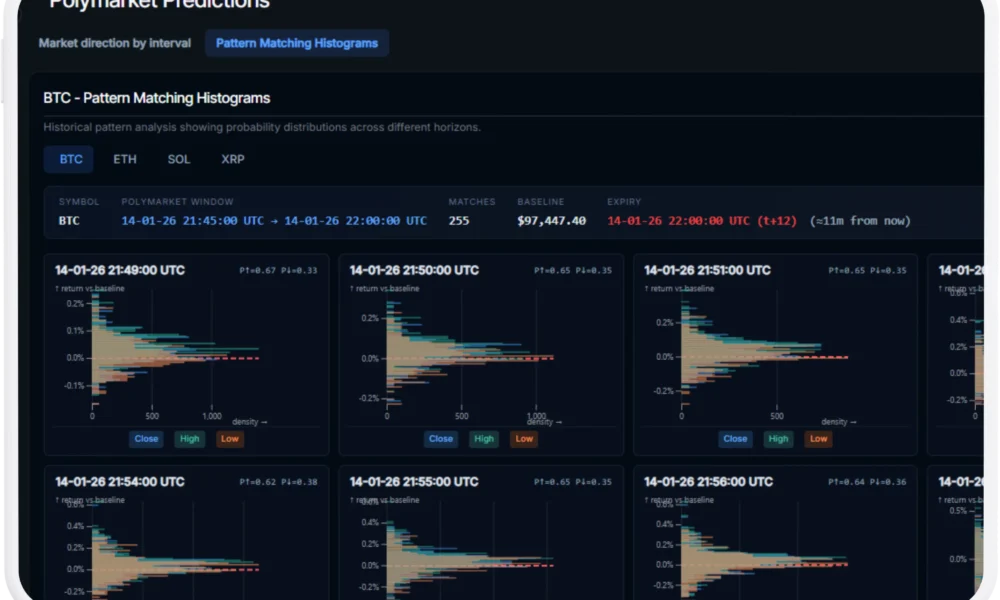
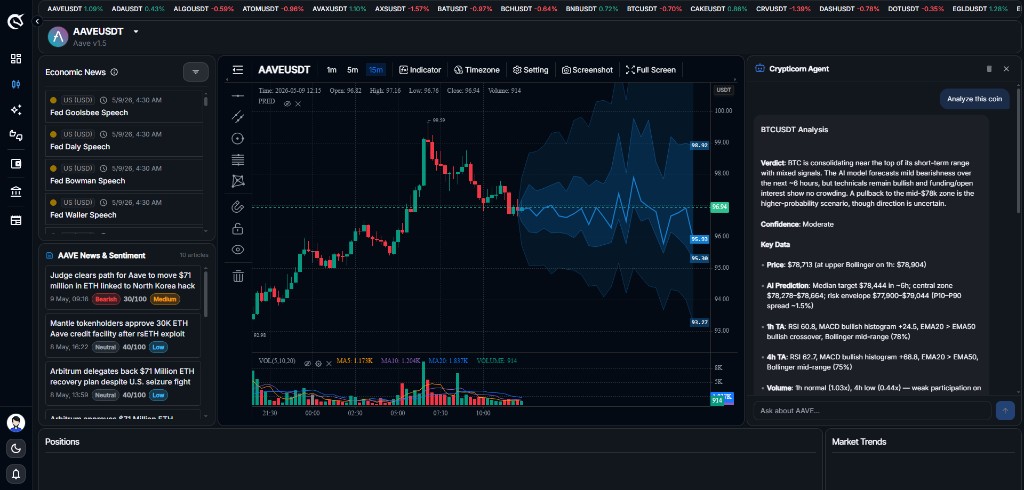
That’s why our product surfaces look like cones and direction probabilities on the Prediction Dashboard and up/down feeds, not a single glowing target price.
Calibration beats a flashy win rate
| Claim you hear | What to ask next | Healthy answer looks like |
|---|---|---|
| “90% accurate AI” | Accurate at what horizon, on what label, including fees? | They can’t defend 90% on fair directional labels |
| “Backtest never loses” | Train/test split? Walk-forward? Live since when? | Out-of-sample + live log with drawdowns shown |
| “Our model knows the price” | Where is the uncertainty band? | P10–P90 (or similar) always visible |
| “68% chance up this hour” | Across hundreds of 68% calls, how often was it up? | Near 68%, not 95% |
Calibration is simple to say and hard to fake for long. If a tool dumps “high confidence” on everything, it’s broken, or optimized for dopamine.
When we say P10–P90, we mean: if the model is calibrated, realized price should land inside that band most of the time. A wide band is not a failure of the UI; it’s the model admitting uncertainty. Trading a wide band like a tight one is how “AI” becomes a tax.
How to evaluate any AI prediction product
- Demand the horizon. No horizon → no accuracy claim.
- Demand the label. Close-to-close? Touch? Mid-window? Including “no trade”?
- Separate train from test. Ask for walk-forward or true holdout. One curve on training data is worthless.
- Ask for live. Paper or production results after the model shipped, with losing months left in.
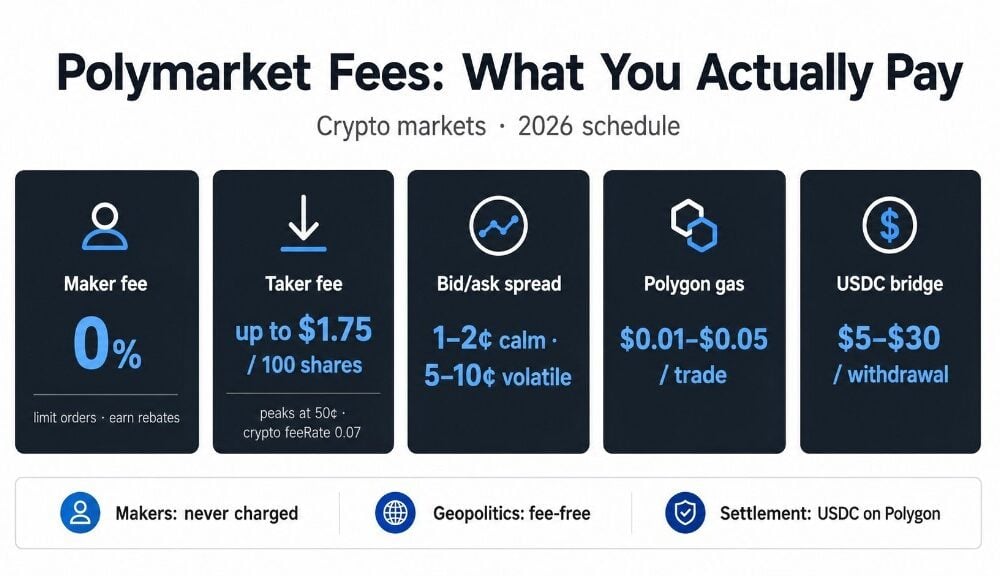
- Price the friction. Add fees, spread, and slippage to the edge. Polymarket-style tickets and perps both punish fantasy math; see also how costs show up in real event-market trading on this site’s Polymarket fee and odds explainers.
- Watch for regime breaks. Accuracy is not a permanent stamp. New market structure decays old patterns until models retrain, one of the limits we spell out in the definitional piece.
If you want a workflow after you trust the numbers, use the complete guide: check → compare → size → invalidate.
Why “high accuracy” marketing usually fails the smell test
- Trivial labels, predicting “volatility exists” or ultra-easy regimes and calling it AI skill.
- Leakage, features that secretly include future information.
- Survivorship, showing only assets and windows that worked.
- Cost-free fantasy, backtests that ignore fees and market impact.
- Horizon bait-and-switch, training on minutes, selling year-ahead certainty.
None of this means AI is useless. It means useful ≠ omniscient. The trustworthy products look almost disappointing next to crypto Twitter, until you care about not blowing up.
Accuracy on event markets vs spot charts
Same probability math, different scoreboard. On spot or perps you’re judged on PnL after costs. On Polymarket/Kalshi-style up/down contracts you’re judged on whether your probability beat the ticket’s implied odds after fees. A model can be “accurate” in a calibration sense and still lose if you buy prices that already embedded the edge.
That’s why we treat up/down feeds as inputs to compare against market odds, not autopilot. Accuracy without price discipline is a lab result.
What we refuse to put on a billboard
I won’t publish a single permanent “Crypticorn accuracy = X%” figure here. Any static number ages the moment regimes shift, labels change, or a fee schedule moves. What we will stand behind is the measurement philosophy: short horizons, explicit uncertainty, calibration checks, and live results that still show the ugly months.
If a competitor’s homepage leads with a forever 90% badge and no methodology, treat that as a different product category, entertainment with an AI filter, not as a benchmark you need to beat.
Protective context on prediction risk more broadly: risks associated with crypto price prediction.
FAQ: how accurate are AI crypto price predictions?
How accurate are AI crypto price predictions?
As exact price forecasts, not very, and serious systems don’t claim otherwise. As short-horizon directional tools, honest models usually show a small edge over 50% when measured fairly. Prefer calibration (do 70% calls happen ~70% of the time?) and live results over a single win-rate screenshot.
Can AI predict Bitcoin’s price accurately?
Not as a precise future print. AI can estimate short-window direction probabilities and ranges for BTC like other liquid assets. Year-ahead exact targets are storytelling, not a reliable accuracy claim.
What is a good accuracy rate for crypto AI models?
There isn’t a universal “good %.” A fair directional edge a few points above 50% on a hard label can be valuable; 90%+ on a vague or leaky label is usually meaningless. Always ask how the rate was defined.
What is calibration in AI price prediction?
Calibration means predicted probabilities match realized frequencies over many trials. If the model assigns 60% to “up” across a thousand hours, roughly 600 of those hours should finish up (plus or minus sampling noise). Miscalibrated models feel confident and still mislead.
Why do vendors claim 90%+ accuracy?
Usually because the metric is soft: easy labels, cherry-picked windows, training-set charts, or ignoring costs. Ask for horizon, label definition, out-of-sample design, and live logs with drawdowns.
How should traders use accuracy numbers?
Use them to set expectations and size, not to justify oversized conviction. Pair any edge estimate with fees, invalidation rules, and the right to skip when the band is wide. More on practical use sits in the complete guide and the lighter how to use AI predictions post.
Final takeaway
- Exact-price “accuracy” is mostly a marketing category.
- Real systems sell calibrated probabilities and short-horizon edges that look small on purpose.
- P10–P90 bands and live logs beat any backtest hero chart.
- If the edge can’t survive fees and skip-discipline, it isn’t an edge.
Want to see how we expose uncertainty instead of fake precision? Start with the Prediction Dashboard and up/down crypto predictions, then keep the evaluation checklist above even when the UI looks convincing.
Written by Johannes Thüroff, M.Eng.
Not financial advice. See Disclaimer.